How many fields are you allowed to ask for? We counted 173 contact forms
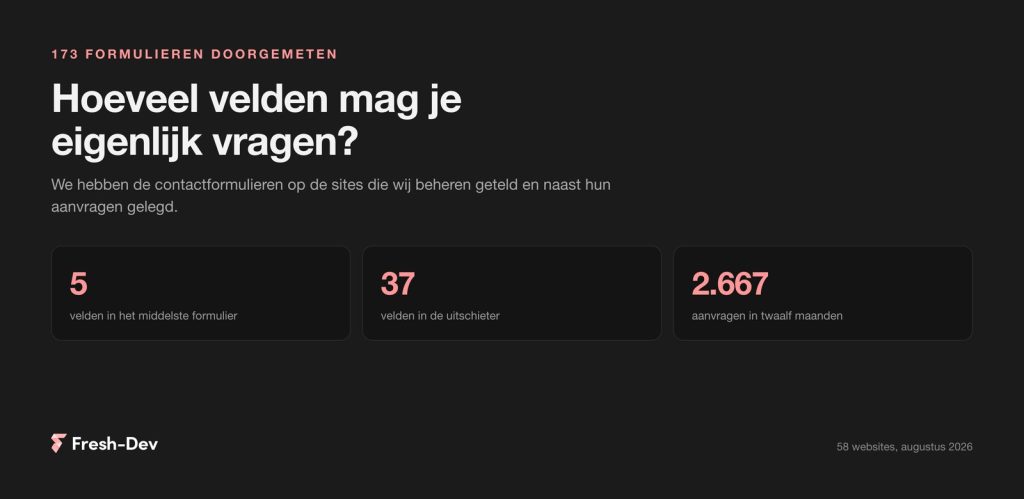
We counted 173 contact forms on 58 sites: how many fields they ask for, what a phone field does with your requests, and which two fields can be omitted.
Read on Jesse
JesseYour visitor numbers in Google Analytics are not your traffic. Analytics only counts what a browser executes with JavaScript, and that is precisely the part that a human causes. Everything else is in your server log, and that log is a lot less flattering.
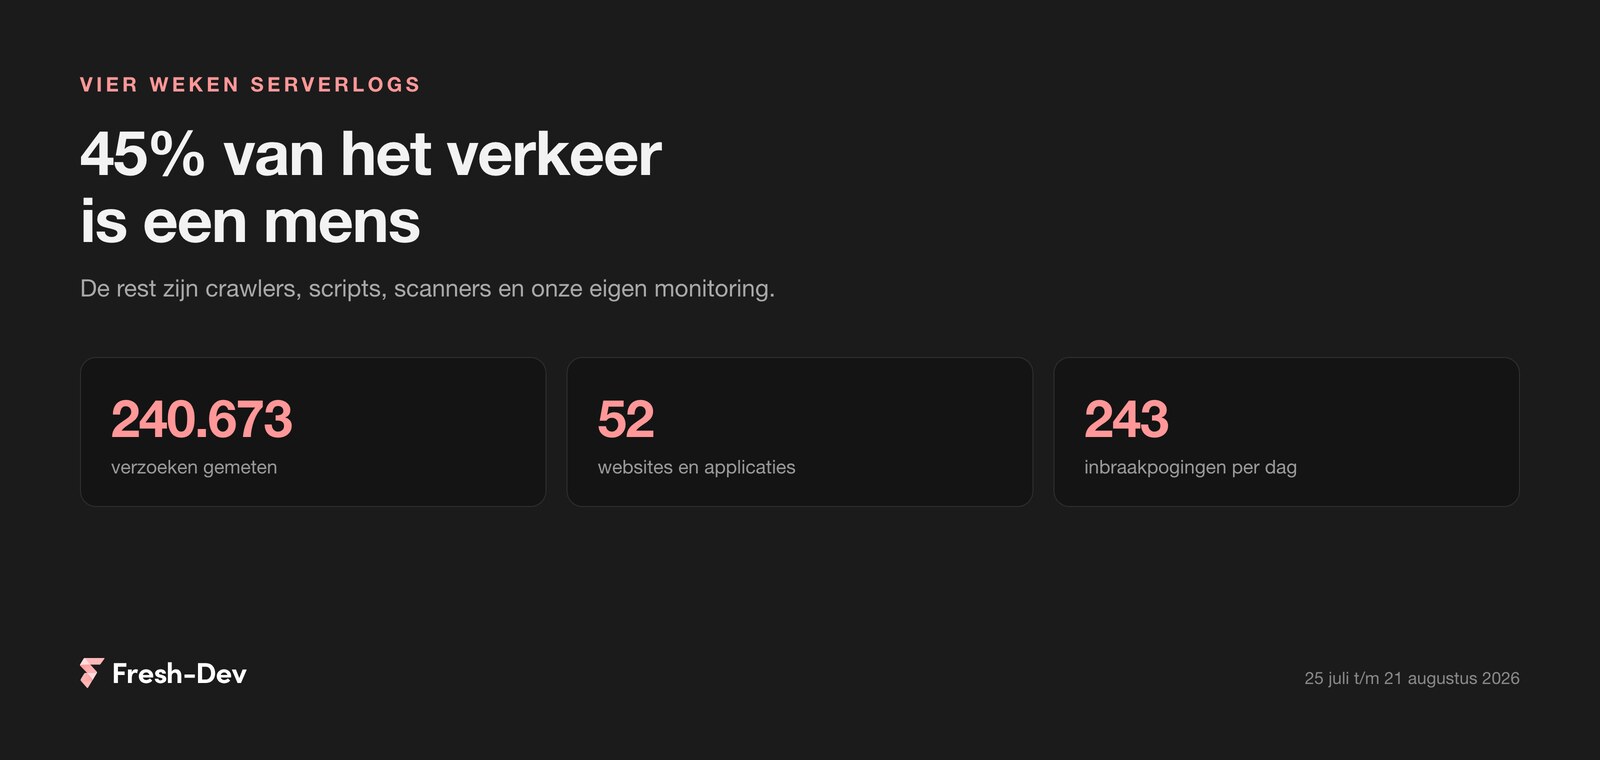
So we decided to dig into our own logs. Four weeks, 52 websites and web applications on one of our servers, 240,673 requests and 46.2 GB of traffic. Then we sorted everything by who requested it. It involves a hodgepodge of sites, from busy webshops to staging environments that only we visit, and it was also measured during the holiday period. Further on, it explains what that does to the figures.
The outcome in brief:
In this article:
Let's talk about the methodology, because figures without a method are just an opinion.
What this is and isn't about. Those 52 domains are neither a cross-section of the Dutch internet nor 52 comparable corporate sites. It is simply what is hosted on our single server: client websites, a few webshops, two web applications, a series of staging environments that only we access, and our own internal tools. The largest site draws thousands of visitors per month, the smallest almost none. A staging environment with no public audience has almost one hundred percent bot traffic and skews the average upwards.
Add to that the period: late July and August is holiday time. Human visits are at a low point then and crawlers don't notice a thing, so the proportion of bots is higher during these weeks than in, for example, October. Therefore, read the percentages below as the ratio on this server during these weeks, not as a national figure. The numbers per crawler are just numbers, and they don't change based on how you convert them.
That last one is immediately the weak spot. A user agent is a line of text that anyone can fill in, and malicious scripts simply put Chrome in there. Everything we count as a bot below is therefore a lower limit. The real share is higher, not lower.
What we haven't done: check IP addresses with the owner of the crawler. Google and OpenAI both publish lists that allow you to verify whether a request claiming to be Googlebot really does come from Google. For an article that is overkill, but not for blocking traffic, because that is precisely the place where you make a mistake that affects your visitors.
The distribution over four weeks, upon request:
Just over half of everything our server had to process, therefore, did not come from a visitor. That aligns nicely with global estimates, which sit around 55 to 60 per cent, and it is more useful because this concerns Dutch sites that we know.
The interesting thing is not in that percentage. It is in who those bots are.
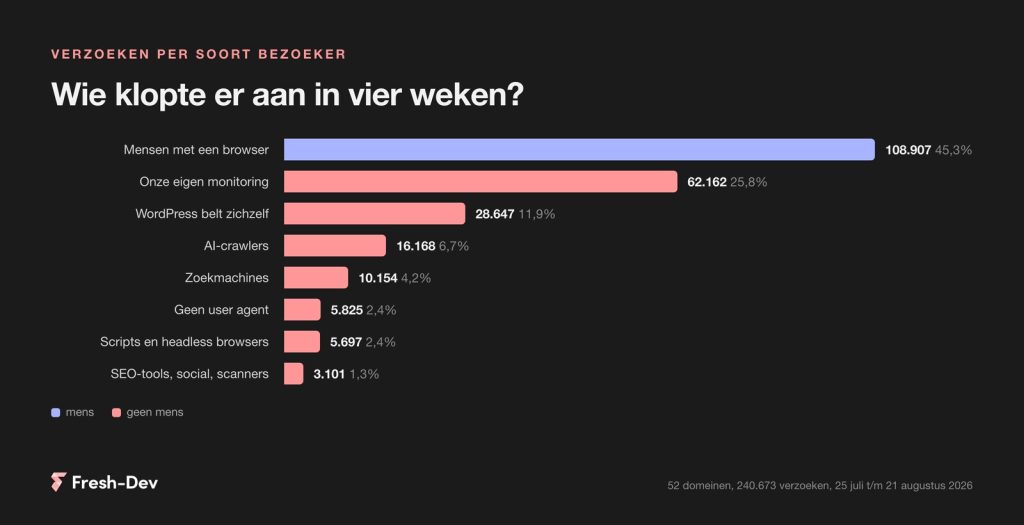
We turned out to be the biggest source of non-human traffic on our server. Two things combined, accounting for 90,809 requests, nearly 38 percent of the total.
Our monitoring: 62,162 requests. Every site that we manage is continuously checked to see if it is still responding, and those checks come from the server itself. That is precisely the intention: that is why we usually know before the client if something goes down. The measurement did show that things could be sharper. Every site was pinged every eight minutes, and across fifty sites that adds up. Moving to a quarter of an hour saves half of that traffic without the monitoring noticeably becoming less effective.
WordPress calling itself: 28,647 requests, of which 27,001 to a single file. That file is wp-cron.php, and this is built into WordPress itself. There is no real scheduler, so every time a page is visited, WordPress checks whether there is a task waiting. On a site with traffic, this happens hundreds of times a day and a new PHP process starts every time. That applies to virtually every WordPress site in the world, including yours.
This is straight away the easiest win to be had and it takes ten minutes. You turn off that internal scheduler and let the server do it at set times, which is also more reliable for scheduled publications. In your configuration:
define('DISABLE_WP_CRON', true);And then a task on the server that takes over, for example every five minutes. Watch out if you are working with a page cache: if no PHP runs anymore for logged-out visitors, that internal scheduler sometimes doesn't fire for days and a scheduled publication simply remains stuck. We experienced that exact thing on our own site.
Before you start blocking, measure first. There is a good chance the busiest bot on your server is your own server.
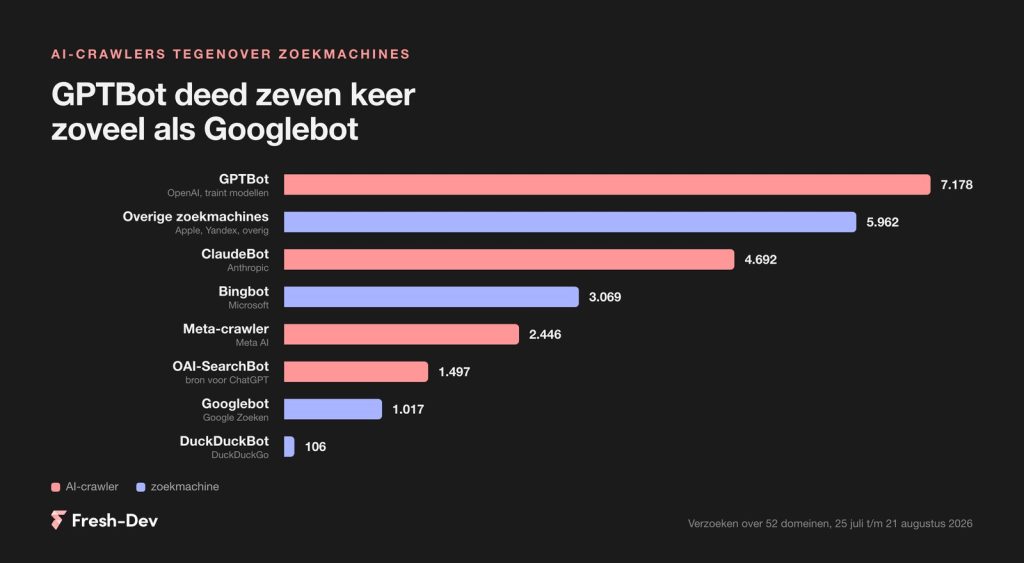
– Jesse Lafeber, Fresh-DevThis is the figure that took even us by surprise. In four weeks:
And the search engines, by comparison:
So GPTBot made seven times as many requests as Googlebot. All AI crawlers combined made over one and a half times as many requests as all search engines combined. Incidentally, the fact that Google ranks so low is not a bad sign: Google crawls efficiently and mainly retrieves content that has changed. The AI crawlers, on the other hand, are far less subtle in their approach.
So the next question is: should you block those things? That depends on which ones.
That distinction is precisely what makes it tricky, because both categories come from the same companies. GPTBot and OAI-SearchBot are both from OpenAI and do completely different things. Anyone who robots.txt If you shut down everything from OpenAI, you’ll also lose your visibility in ChatGPT.
Our policy is this: as far as we’re concerned, training crawlers should be removed from sites where this is a sensitive issue, whilst search crawlers should be left alone. And this should be assessed on a site-by-site basis, as an online shop and a knowledge base do not have the same interests in this regard.
Bots cost you two things, and it’s easy to get them mixed up.
Bandwidth is the least significant. All the AI crawlers combined used up 139 MB in four weeks. That’s nothing. By way of comparison: amongst the scripts and headless browsers, there was one client that used up 8.9 GB, and almost all of that was down to autoplay videos in the header of a few websites. A single 12 MB hero video that loads with every visit costs you more than all the AI bots put together. If you want to save on bandwidth, look at your videos and images first.
Server work is the real problem. A request that bypasses the cache and triggers PHP takes between 200 and 800 milliseconds to process. A request that comes from the cache takes virtually no time at all. The difference between the two is whether your server even notices.
That is why a page cache is more important for bot traffic than for visitors. Visitors tend to visit just a handful of pages, and those are likely to be in the cache anyway. A crawler scans your entire site, including those 400 archive pages that no one ever visits. Without a cache, that amounts to 400 complete PHP processes and 400 sets of database queries.
The server from which this measurement originates runs a page cache, and enabling it reduced the response time from 1.6 seconds to 88 milliseconds. The same improvement applies to every crawler request.
6,809 requests in four weeks were directed to login pages, to xmlrpc.php, to .env-files and the WordPress installation script. That’s 243 a day across 52 sites.
These also included requests for files that only exist if a site is already infected. Names such as wp_filemanager.php in a plugin folder that does not belong to an actual plugin. These requests are not so much an attack as a survey: someone is scouring the internet in search of sites that have already been hacked and where the backdoor is still open.
This is just background noise from the internet, and no one here is being targeted personally. Of these 6,809 attempts, not a single one has been successful in the past four weeks, and that is precisely what the standard security measures are for: no accounts with the username ‘admin’, two-factor authentication for administrators, xmlrpc.php shut when not in use, a firewall that blocks repeated failed attempts, and updates that are actually run rather than postponed.
The rating is therefore not an alarm signal but a benchmark. Every site on the internet gets this treatment. The difference lies in whether someone is watching.
Specifically, and in order of what they deliver:
What we wouldn't do: hard block everything that looks like a bot. In this measurement there were three categories that you don't want to lose and that look the same from the outside as the rest: the search engines, the crawlers that put you in AI answers, and the social networks that fetch a preview when someone shares your link. Too crude a block and your links on LinkedIn suddenly become grey boxes.
You can do this yourself on any server where you have access to the access log. This rule counts your visitors per user agent and puts the busiest at the top:
awk -F'"' '{print $6}' access_log \
  | sort | uniq -c | sort -rn | head -25
And that is how you see how many requests the AI crawlers made:
grep -cE 'GPTBot|ClaudeBot|PerplexityBot|Bytespider' access_logIf you are on shared hosting without access to the logs, you can ask your host for an export. If they refuse, that in itself is also information.
What to look out for when reading: look at requests and not visitors, because the latter do not exist in a log. And include the status codes. Thousands of requests that all result in a 404 mean something very different from thousands of requests that successfully return a page.
Share your website with us and we'll take a look at the logs together: which bots are visiting, how much server work that costs, and where the easy wins are. You'll hear from us within one working day.
The conclusion from four weeks of measuring is not that the internet is full of bots, because we already knew that. It is that the bulk of the traffic you can actually do something about comes from your own home. A check that looks more often than necessary, WordPress that keeps calling itself, and a video that loads on every visit. Those are precisely the three where you are at the controls.
Before you start blocking, measure first. There is a fair chance that the busiest bot on your server is your own server.
Would you like to know what is visiting your site, or are you running into a server that is heavier loaded than you would expect? We are happy to take a look with you.
We counted 173 contact forms on 58 sites: how many fields they ask for, what a phone field does with your requests, and which two fields can be omitted.
Read on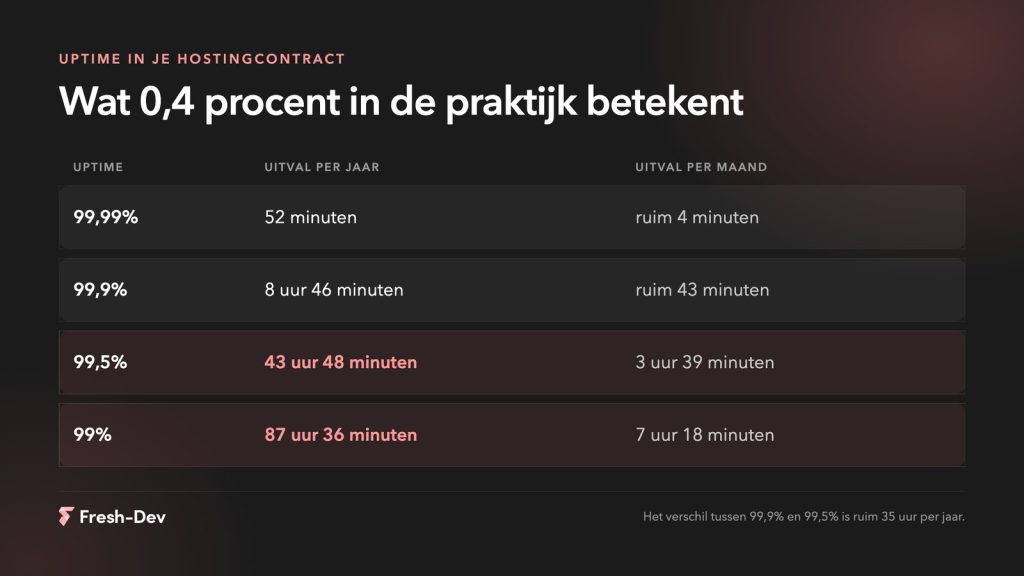
Website downtime costs more than lost revenue. Seven hidden costs and how to prevent them before they add up.
Read on
Measuring GEO optimisation without search rankings. Six figures that show whether AI mentions you, what you'd better not measure, and how to set up a baseline measurement.
Read on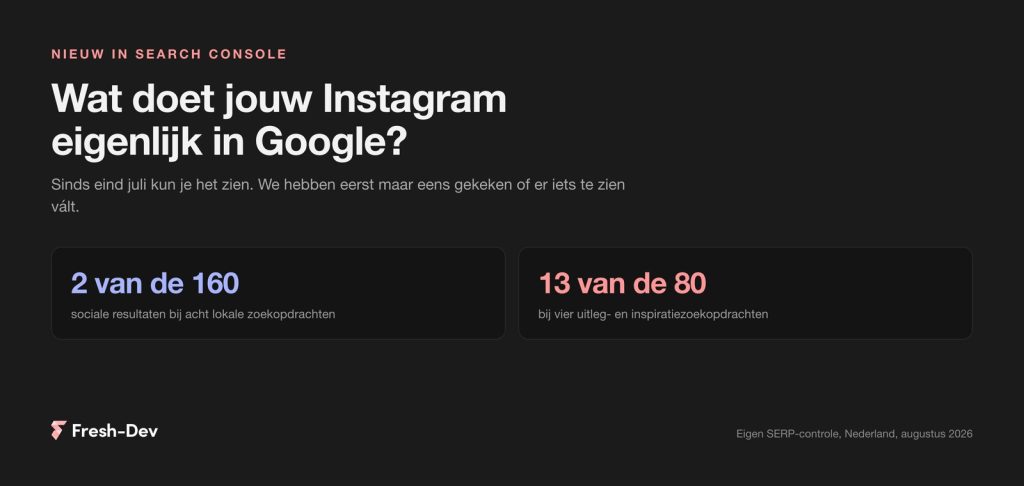
Search Console has been showing what Google sends to your Instagram, TikTok, X and YouTube since July. We checked twelve Dutch search queries.
Read on
What Claude Skills are, how to create one yourself in ten minutes, and where to place them in Cowork, Claude Code and the API. With an example and common mistakes.
Read on
Elementor Pro 4.2.2 patches a vulnerability in the upload field of the form block. Check in 30 seconds if your site is at risk and what you need to do now.
Read on